. índice . Prefacio . Preface . . aguas . 1 . 2 . 3 . 4 . 5 . 6 . . contamina 1 . 2 . 3 . 4 . 5 . 6 . . holocausto 1 . 2 . 3 . 4 . 5 . 6 . 7 . 8 . 9 . 10 . 11 . 12 . 13 . . lineas 1 . 2 . 3 . 4 . . hidrotermias 1 . 2 . 3 . 4 . 5 . 6 . . nuevas 1 . 2 . 3 . . Reconquista 1 . 2 . . hidrogeo 1 . 2 . 3 . 4 . 5 . 6 . . esbozos 1 . 2 . 3 . 4 . 5 . 6 . 7 . 8 . . corredorcentral 1 . 2 . 3 . 4 . 5 . . cordones 1 . 2 . 3 . 4 . 5 . . epiola 1 . 2 . 3 . 4 . 5 . 6 . . deriva 1 . 2 . 3 . 4 . 5 . 6 . 7 . 8 . 9 . 10 . 11 . 12 . 13 . 14 . . archivo 1 . 2 . 3 . 4 . . Halcrow 1 . 2 . 3 . 4 . 5 . 6 . . frentehalino 1 . 2 . 3 . 4 . 5 . 6 . 7 . 8 . . emicampanaoculto 1 . 2 . 3 . 4 . 5 . 6 . 7 . . Costa del Plata 0 . 1 . 2 . 3 . 4 . 5 . 6 . . Costa del oro 1 . 2 . . IRSA 1 . 2 . 3 . 4 . . flujos . . segmentos . . pendientes 1 . 2 . 3 . 4 . 5 . 6 . . delta 1 . 2 . 3 . 4 . 5 . . propuesta . 1 . 2 . . correconvectivo 1 . 2 . 3 . 4 . 5 . 6 . . plataforma 1 . 2 . . termodinamica 1 . 2 . 3 . . ABL 1 . 2 . . congreso . . girh . . Acumar 1 . 2 . 3 . 4 . . evaluacion 1 . 2 . . BocaRiachuelo 1 . 2 . 3 . 4 . 5 . 6 . 7 . 8 . 9 . 10 . 11 . 12 . 13 . 14 . 15 . 16 . 17 . 18 . 19 . 20 . . StoDomingo . . urgenciasatadas 1 . 2 . . inundabaires 1 . 2 . 3 . 4 . . sinsustento 1 . 2 . . emisarios 1 . 2 . 3 . 4 . 5 . 6 . 7 . 8 . 9 . 10 . . UAG 1 . 2 . 3 . . áreas nuevas 1 . 2 . 3 . . acreencias 1 . 2 . 3 . 4 . 5 . . audiencia 1 . 2 . 3 . 4 . 5 . 6 . 7 . 8 . 9 . . Valls 1 . 2 . . contrastes 1 . 2 . 3 . 4 . 5 . 6 . 7 . 8 . 9 . 10 . . convexterna . . playas 1 . 2 . 3 . 4 . 5 . 6 . 7 . 8 . 9 . . Plan Maestro 1 . 2 . 3 . . Parque Norte . 1 . 2 . . ribera . 1 . 2 . 3 . 4 . 5 . . jurisdiccion 1 . 2 . 3 . 4 . 5 . 6 . 7 . 8 . 9 . 10 . 11 . 12 . . CSJNpisamr 1 . 2 . 3 . 4 . . zonas muertas . . Bermejo 1 . 2 . . Pilcomayo . . Salado . . Uruguay 1 . 2 . . Parana . . Areco 1 . 2 . . Samborombon . . PuntaPiedras . . Tuyú . . PuntaRasa 1 . 2 . . PuntaMedanos . . Mar Chiquita 1 . 2 . 3 . 4 . 5 . . Mar del Plata 1 . 2 . 3 . 4 . 5 . . Necochea . . Colonia . . MartinGarcia 1 . 2 . 3 . . Puertos 1 . 2 . . formula1 . . disocio . . senderos . . bajante . . . . oceano 1 . 2 . . hidrolinea 1 . 2 . 3 . . sustentable. 1 . 2 . . agua 1 . 2 . 3 . . antarticflows . . derrame . . luna 1 . 2 . 3 . 4 . 5 . 6 . . index .
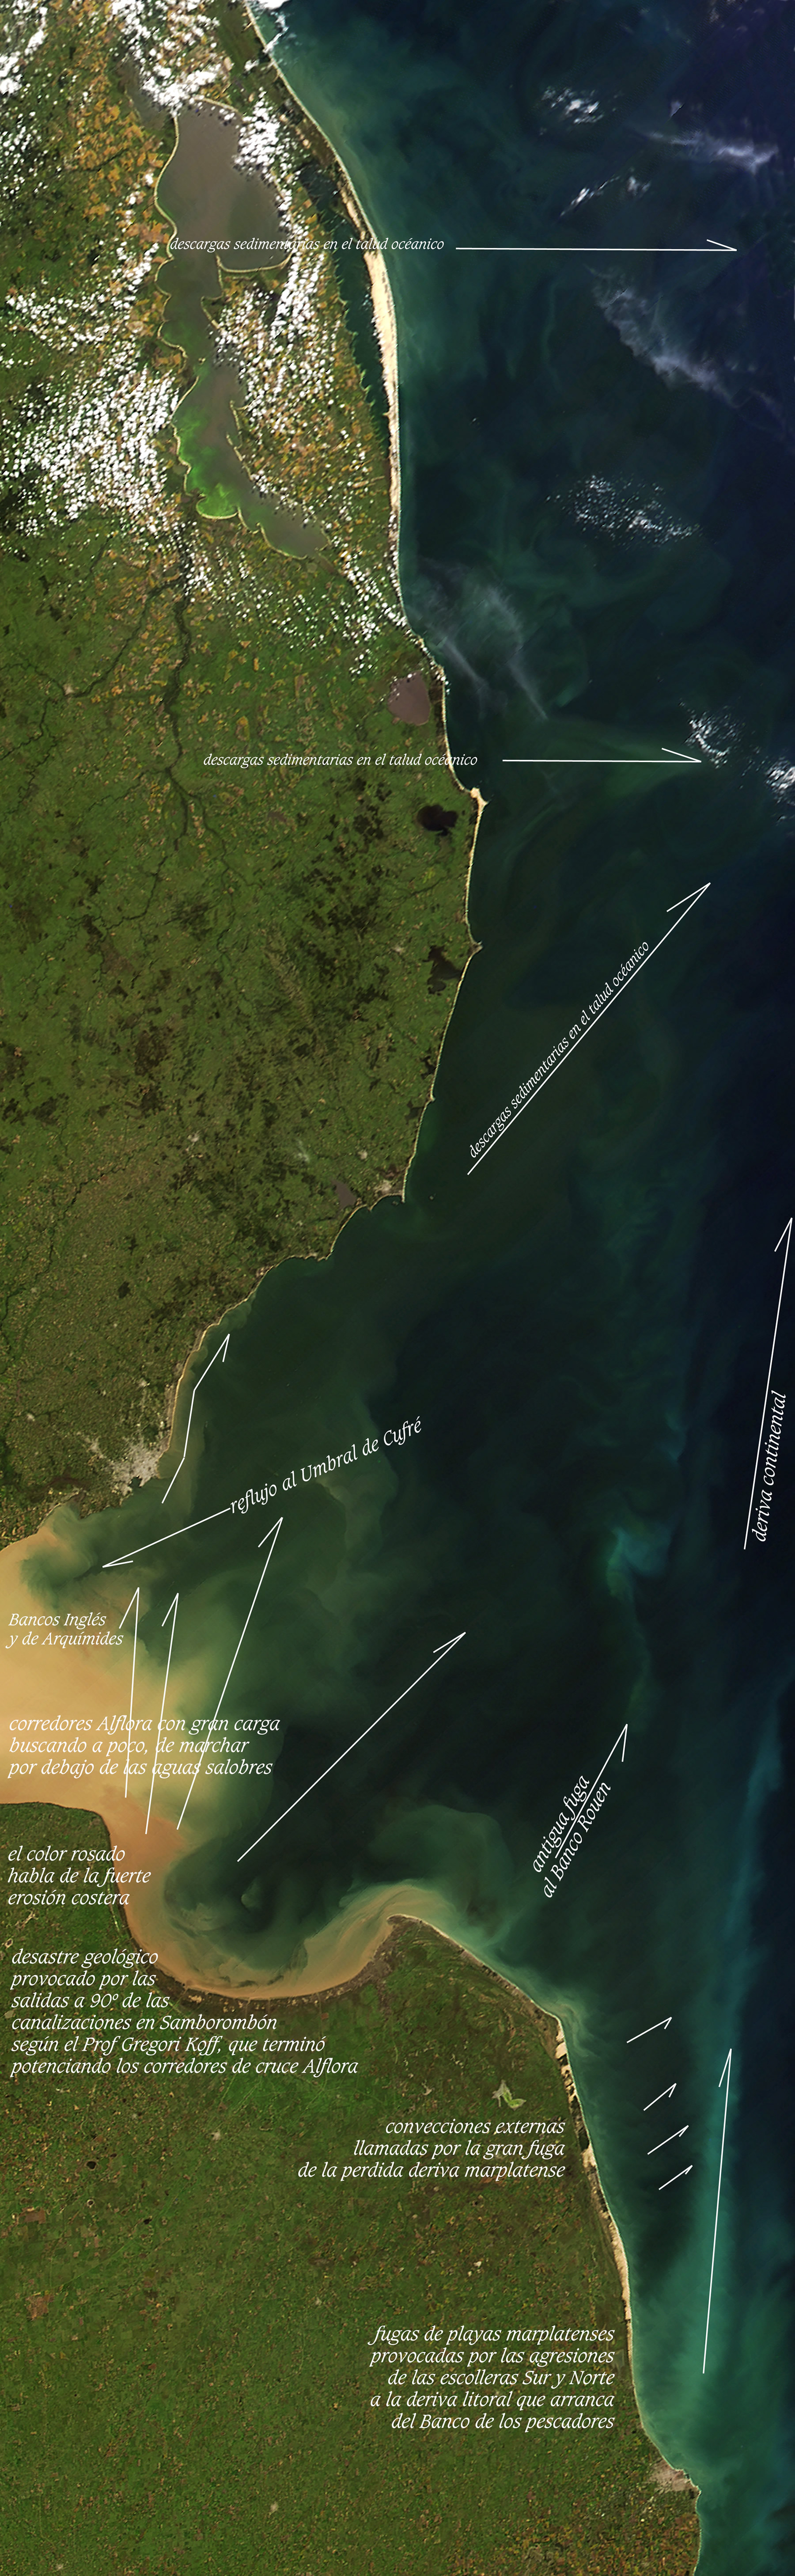
Erosiones al NO y SO de Punta Indio. Corredores convectivos dulces en el frente halino, en la ribera continental y sus deposiciones en conos en el talud oceánico. Fugas de Mar del Plata.
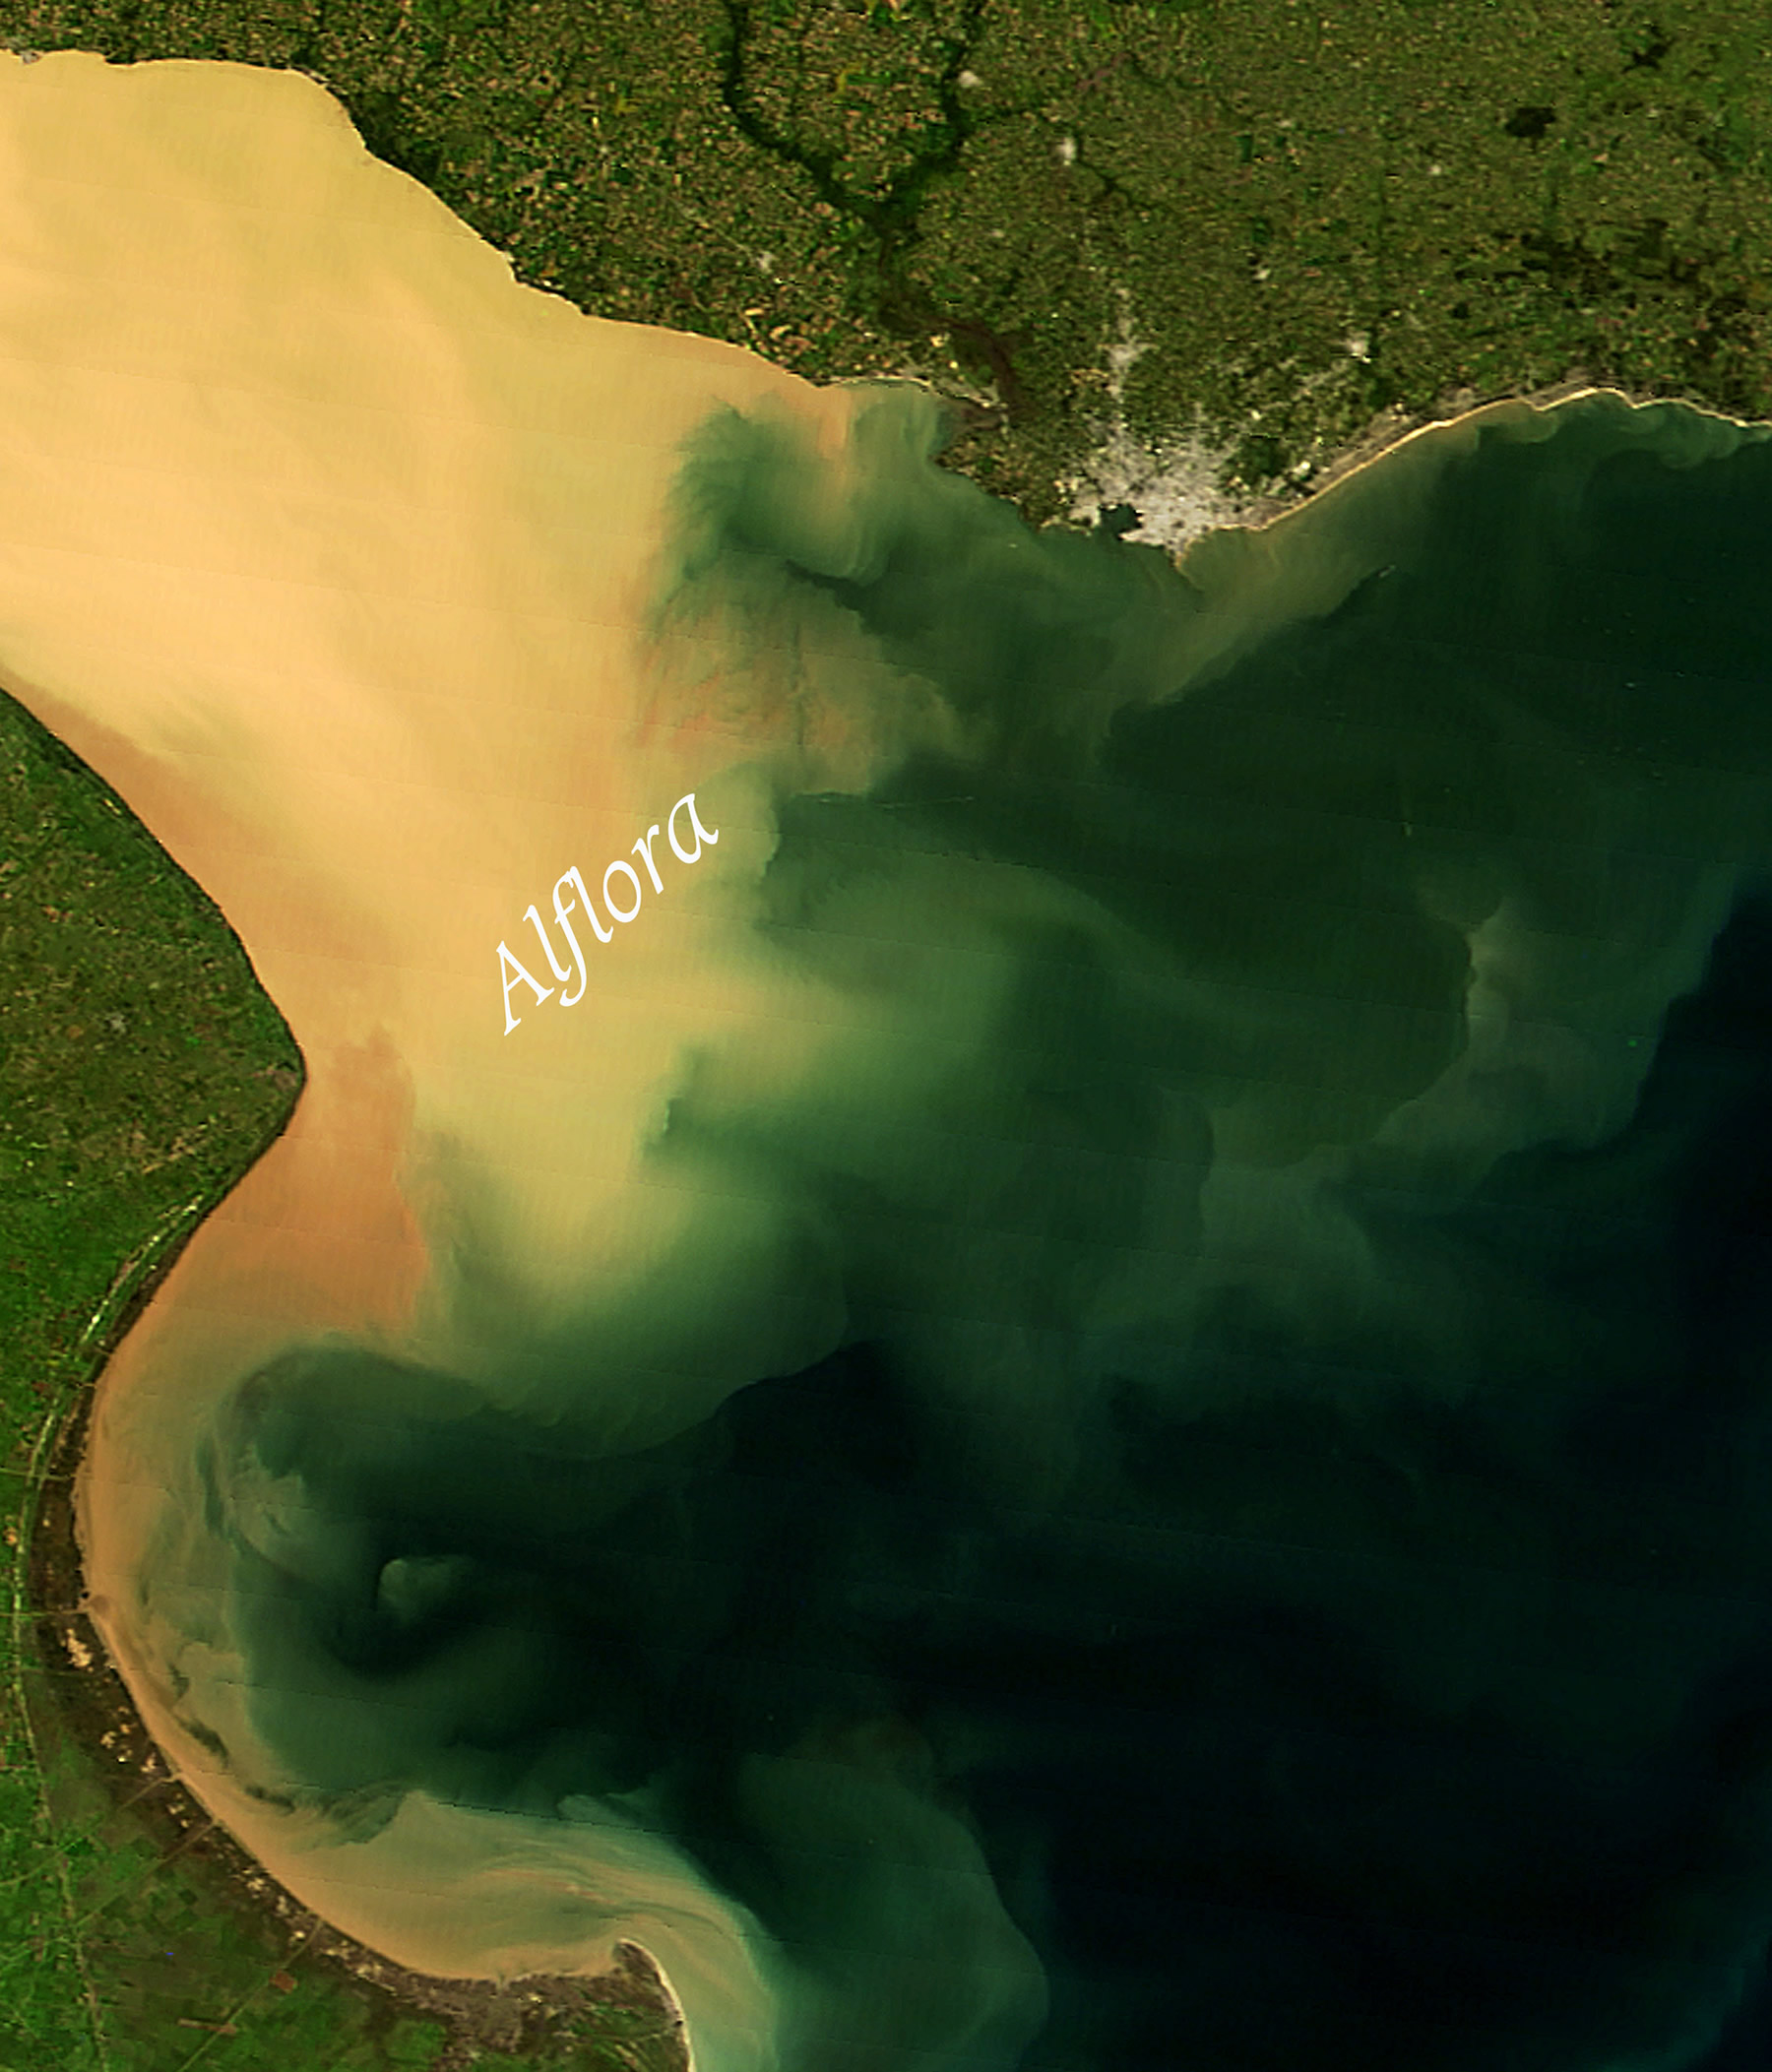
On March 31, 2012, the Moderate Resolution Imaging Spectrometer (MODIS) on the Terra satellite captured this view of muddy water from the Paranà River flowing into the Río de La Plata.
The image offers a glimpse of the complicated mixing processes that occur at the interface of the muddy fresh water from the Paranà and the ocean water of the South Atlantic in an area known as a turbidity front. The location of the turbidity front varies over the course of the year. It tends to be in its western most position during the summer when river discharge is at a minimum and the predominant winds are from the northeast, while it reaches its easternmost position in the spring when strong winds from the southwest are present.
Los corredores de flujos convectivos naturales positivos reconocen variadas formas de recarga de energía; ya sea por meandros dinámicos, esteros aledaños, aguas someras de bañados transferidas por costas blandas y bordes lábiles, por dar ejemplo; como por la energía del sol que capturan y envuelve a los sedimentos. Por ello, estos grandes corredores, aún en mar abierto, son capaces de sostener la "personalidad" de sus extendidas disociaciones, reteniendo en su carga sedimentaria la fuente de energía que opera como portátil batería convectiva propia.
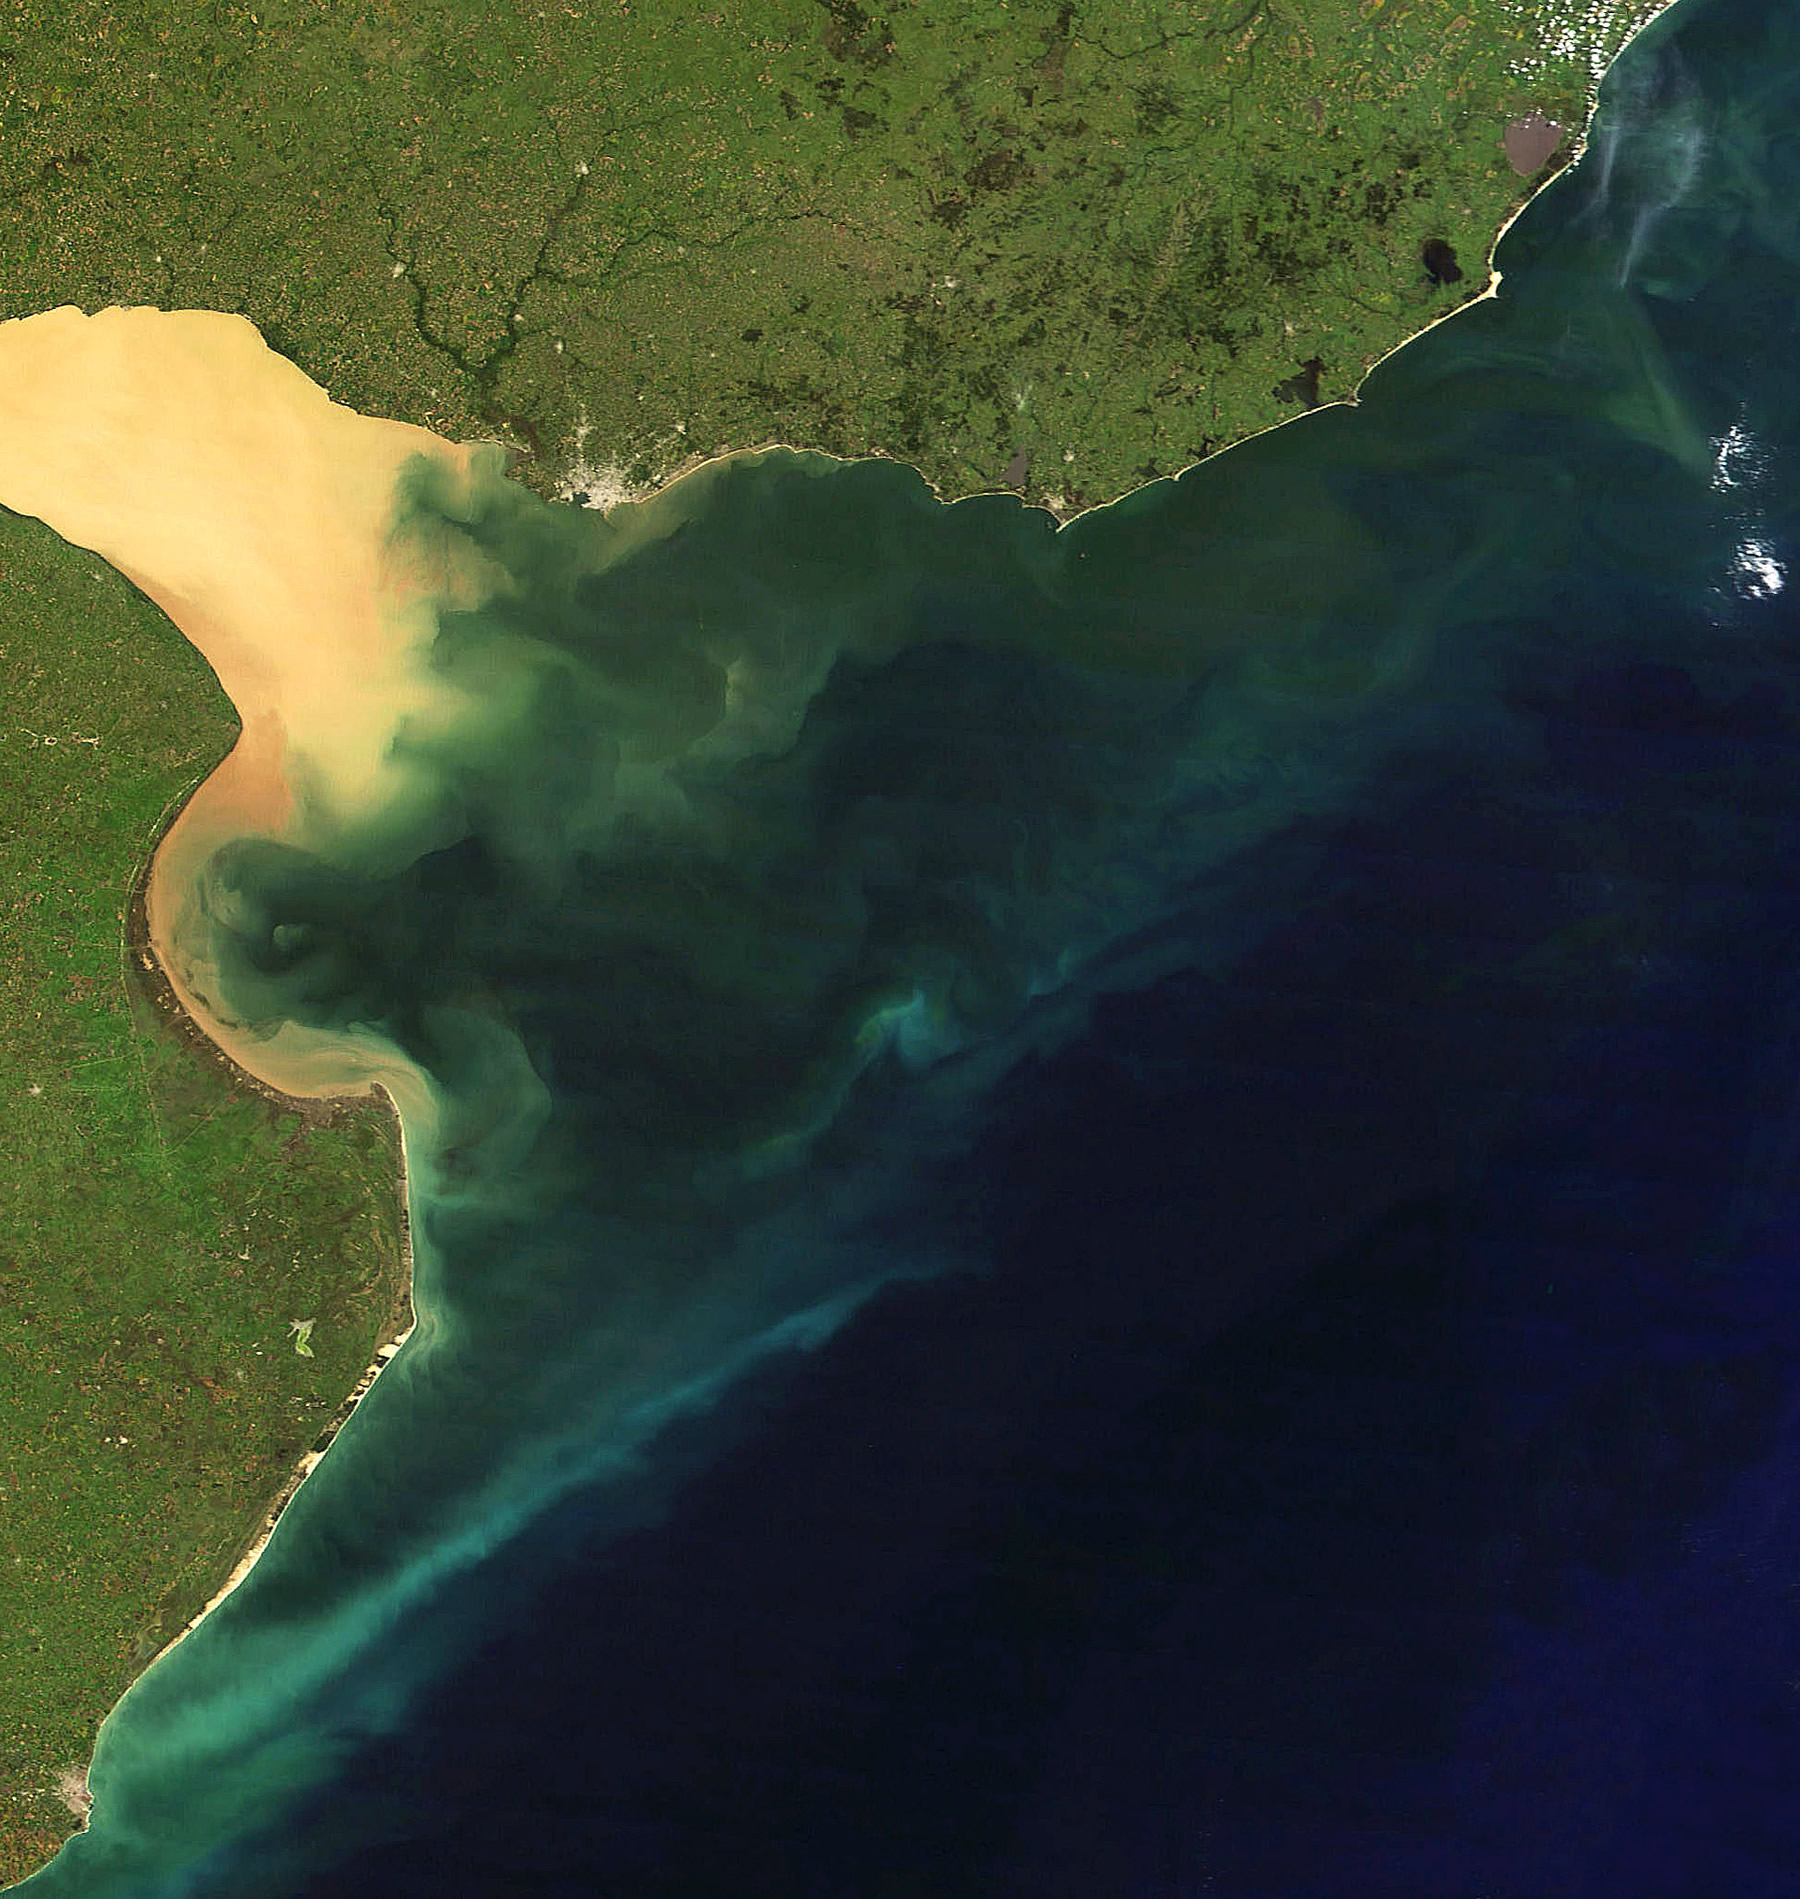
Vistas de los conos de sedimentación en el talud oceánico
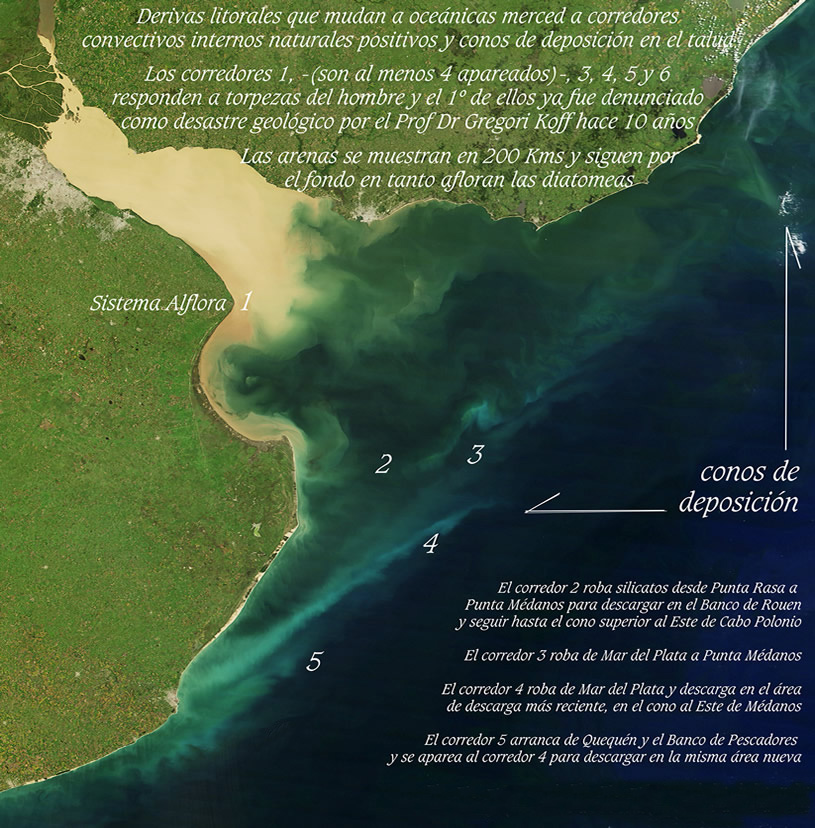


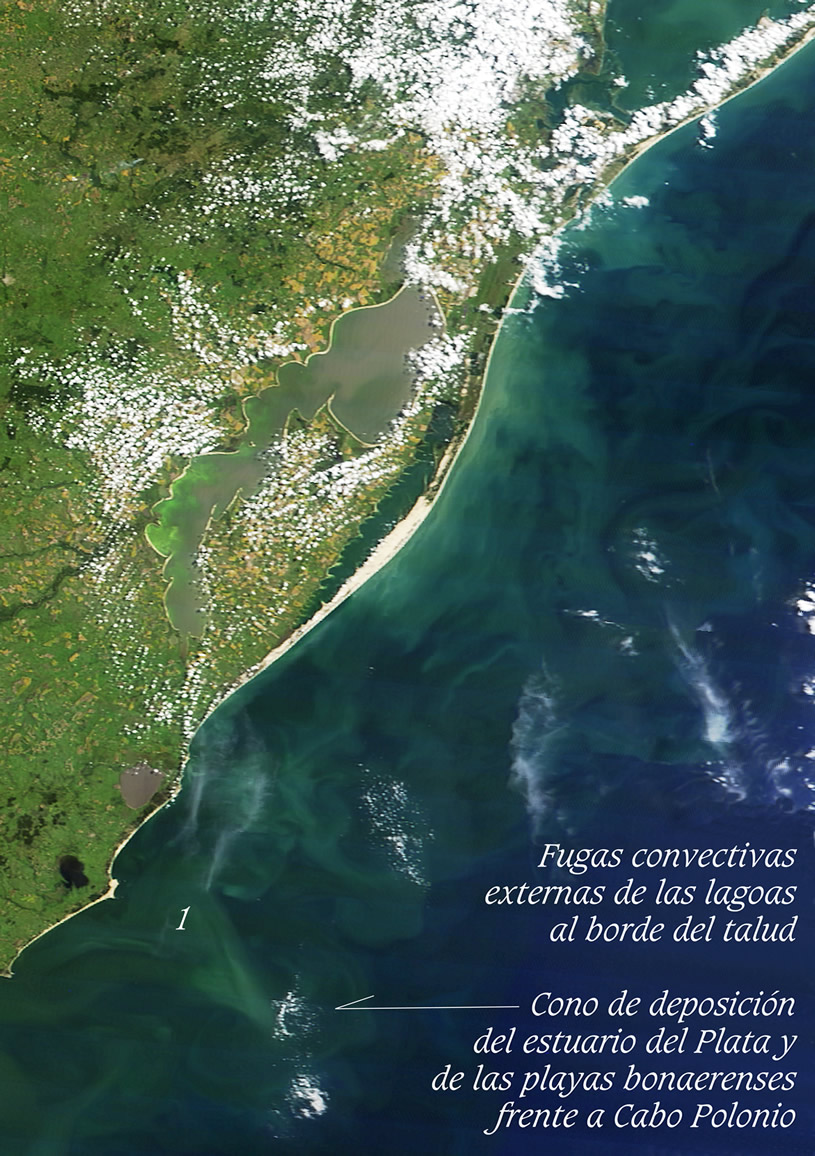
Otros corredores convectivos internos naturales positivos. Derivas litorales devenidas oceánicas por culpa de las obras del hombre, cargando en poco más de 50 años con el monumental desastre hidrogeológico del robo de cientos de millones de toneladas de arenas de las playas atlánticas.

Referencias de trabajos realizados con criterios mecánicos, sin distinción en la columna de agua y por ello, con conceptos primarios de las energías mareales y de la personalidad de los corredores convectivos internos naturales positivos.
- Framinan, M. (1999) Study of the Río de la Plata Turbidity Front, Part 1: Spatial and Temporal Distribution.Continental Shelf Research, 1259-1267.
- Acha, E. (2008) An Overview of Physical and Ecological Processes in the Río de la Plata Estuary.Continental Shelf Research. 28(13) 1579-1588.
Study of the Río de la Plata turbidity front, Part 1: spatial and temporal distribution
- Mariana B. Framiñan,
- Otis B. Brown
- a Servicio de Hidrografía Naval, Avda. Montes de Oca 2124, Buenos Aires 1271, Argentina
- b Rosenstiel School of Marine and Atmospheric Science, University of Miami, 4600 Rickenbacker Causeway, Miami, FL33149, U.S.A.
Abstract
The Río de la Plata is a riverine system located on the east coast of South America at 35°S. It covers 35,000 km2, it is 320 km long and 230 km wide at the mouth. The Río de la Plata drains the second largest basin in South America with an average discharge of 22,000 m3 s−1. The processes associated with the interaction of the fresh river water and the saline shelf water and tidal stirring generate a turbidity front in the outer region, which is clearly defined in the satellite images as a strong gradient in reflectance and a sharp change in water color.
We use a 4 yr span of NOAA-AVHRR daily images, from September 1986 to August 1990, to determine the spatial and temporal distribution of the turbidity front. Channels 1 and 2 (visible and near-infrared) are used to digitize the fronts, and channel 4 and sea surface temperature are used as complementary information for cloud detection. From a total of 2578 images, 1274 daytime images allowed us to determine 333 positions of the front. This information is used to estimate the distribution of the frontal density, a probabilistic measure of frontal occurrence. Monthly, seasonal and annual analyses were performed. The relation of the turbidity front patterns to bathymetry, tidal dynamics, river discharge and winds were investigated. A comparison between the frontal density distribution and stratification parameters is presented.
The results show a high degree of variability of the frontal distribution at the northern coast of the estuary. In this region, the frontal position varies between 57°W and 54°12′W. The westernmost location occurs in the summer months, which is coincident with minimum river discharge, predominance of easterly winds and minimum occurrence of southwesterlies. The easternmost location occurs during the spring, with strong winds from the southwest. At the southern coast the modal position of the front coincides with the 5 m isobath, although great variations to this position have been observed during years of large river discharge. The fall and winter are seasons of maximum river discharge. During these periods there is a bimodal frontal distribution with maximum values of frontal density at the northern area of Bay of Samborombón and south of Montevideo, and higher variability in the center of the river.
An overview of physical and ecological processes in the Rio de la Plata Estuary
- E. Marcelo Acha
- Hermes Mianzan
- Raúl Guerrero,
- José Carreto
- Diego Giberto
- Norma Montoya
- Mario Carignan
- a INIDEP—Instituto Nacional de Investigación y Desarollo Pesquero, Paseo Victoria Ocampo No. 1, 7600 Mar del Plata, Argentina
- b Universidad Nacional de Mar del Plata, Argentina
- c CONICET—Consejo Nacional de Investigaciones Científicas y Técnicas, Argentina
Abstract
The Rio de la Plata is a large-scale estuary located at 35°S on the Atlantic coast of South America. This system is one of the most important estuarine environments in the continent, being a highly productive area that sustains valuable artisanal and coastal fisheries in Uruguay and Argentina. The main goals of this paper are to summarize recent knowledge on this estuary, integrating physical, chemical and biological studies, and to explore the sources and ecological meaning of estuarine variability associated to the stratification/mixing alternateness in the estuary. We summarized unpublished data and information from several bibliographic sources. From study cases representing different stratification conditions, we draw a holistic view of physical patterns and ecological processes of the stratification/mixing alternateness. This estuary is characterized by strong vertical salinity stratification most of the time (the salt-wedge condition). The head of the estuary is characterized by a well-developed turbidity front. High turbidity constrains their photosynthesis. Immediately offshore the turbidity front, water becomes less turbid and phytoplankton peaks. As a consequence, trophic web in the estuary could be based on two sources of organic matter: phytoplankton and plant detritus. Dense plankton aggregations occur below the halocline and at the tip of the salt wedge. The mysid Neomysis americana, a key prey for juvenile fishes, occurs all along the turbidity front. A similar spatial pattern is shown by one of the most abundant benthic species, the clam Mactra isabelleana. These species could be taken advantage of the particulate organic matter and/or phytoplankton concentrated near the front. Nekton is represented by a rich fish community, with several fishes breeding inside the estuary. The most important species in terms of biomass is Micropogonias furnieri, the main target for the coastal fisheries of Argentina and Uruguay. Two processes have been identified as producing partially stratified conditions: persistent moderate winds (synoptic scale), or low freshwater runoff (interannual scale). Less frequently, total mixing of the salt wedge occurs after several hours of strong winds. The co-dominance of diatoms (which proliferate in highly turbulent environments) and red tides dinoflagellates and other bloom taxa (better adapted to stratified conditions), would indicate great variability in the turbulence strength, probably manifested as pulses. Microplankton and ichthyoplankton assemblages defined for the stratified condition are still recognized during the partially mixed condition, but in this case they occupy the entire water column: vertical structure of the plankton featuring the stratified condition become lost. Bottom fish assemblages, on the contrary, shows persistence under the different stratification conditions, though the dominant species of the groups show some variations. Summarizing, the Río de la Plata Estuary is a highly variable environment, strongly stratified most of the time but that can be mixed in some few hours by strong wind events that occur in an unpredictable manner, generating stratification/partially mixed (less frequently totally mixed) pulses all along the year. At larger temporal scales, the system is under the effects of river discharge variations associated to the ENSO cycle, but their ecological consequences are not fully studied.
Keywords
- Brackishwater ecology;
- Salt-wedge estuaries;
- Vertical mixing;
- Review;
- South America;
- Argentina;
- 34–37°S latitude;
- 54–58°W longitude

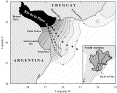
Fig. 1. The Río de la Plata Estuary. Mean surface salinity for spring (from Guerrero et al., 1997 b). Grayed zone (isohalines each 2.5 unit) represents the mixing zone. Black region shows the tidal river. White star shows Pontón Recalada weather station. Symbols show stations locations of the sections in Fig. 2 (+, 2A; ●, 2B; ▵, 2C; ★, 2D). Inset: Río de la Plata basin.


Fig. 2. Salinity sections of the Río de la Plata Estuary: (A) the stratified (salt wedge) condition, (B) partially mixed condition forced by wind, (C), partially mixed condition induced by extreme low river discharge, and (D) totally mixed condition due to strong winds. Numbers at the top axis show values of the Simpson stratification parameter. Double headed arrows indicate the transition zones between stable (stratified) and unstable (mixed) regions of the estuary.
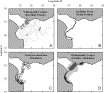

Fig. 3. Ecological processes at the Río de la Plata Estuary. (A) Distribution of whitemouth croaker gravid females, and bottom salinity field (symbol size proportional to females abundance, redrawn from Macchi et al., 1996). (B) Modal position of the turbidity front in the estuary (redrawn from Framiñan and Brown, 1996). (C) Distribution of the mysid Neomysis americana (symbol size proportional to abundances, redrawn from Schiariti et al., 2006). (D) Young-of-the-year whitemouth croaker distribution (redrawn from Lagos, 2002).
Justamente en las mismas áreas donde se manifiesta la mayor energía de atrape de flujos de la costa bonaerense y de velocidad (2,7 nudos) del corredor Alflora.

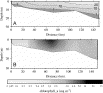
Fig. 4. Light and chlorophyll along the Río de la Plata Estuary: (A) light penetration distribution as percentage of the incident radiation and (B) distribution of chlorophyll a (mg m−3) as determined by HPLC.

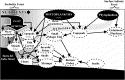
Fig. 5. Conceptual diagram of some of the main trophic relations in the Río de la Plata Estuary.


Fig. 6. Bottom fish assemblages and bottom salinity distribution for three different stratification conditions: (A) and (B) stratified (salt wedge); (C) and (D) totally mixed condition due to strong winds; (E) and (F) partially mixed condition induced
Table 1. SIMPER (“similarity percentages” analysis) results for comparison between the estuarine and marine groups for the three stratification conditions
![]()
Typical species (those contributing more than 90% to the average similarity for each group “estuarine” and “marine”) and discriminating species (those contributing more than 90% to the average dissimilarity between groups “estuarine” and “marine”) are listed (% contribution in parenthesis).
Corresponding author at: INIDEP—Instituto Nacional de Investigación y Desarollo Pesquero, Paseo Victoria Ocampo No. 1, 7600 Mar del Plata, Argentina. Tel.: +54 223 4862586; fax: +54 223 4861830.